Scaling data monitoring with ease: Updates to Datafold Monitors
Discover new features in Datafold Monitors, including REST API support, custom tags, failed record CSV, and enhanced insights.
In October, we released Monitors in Datafold, so your team can identify and resolve data quality issues faster than ever before. Since then, we’ve made considerable product updates to help teams manage data monitors at scale, resolve issues with urgency, and make creating and managing monitors easier than ever.
Better ways to manage monitors at scale
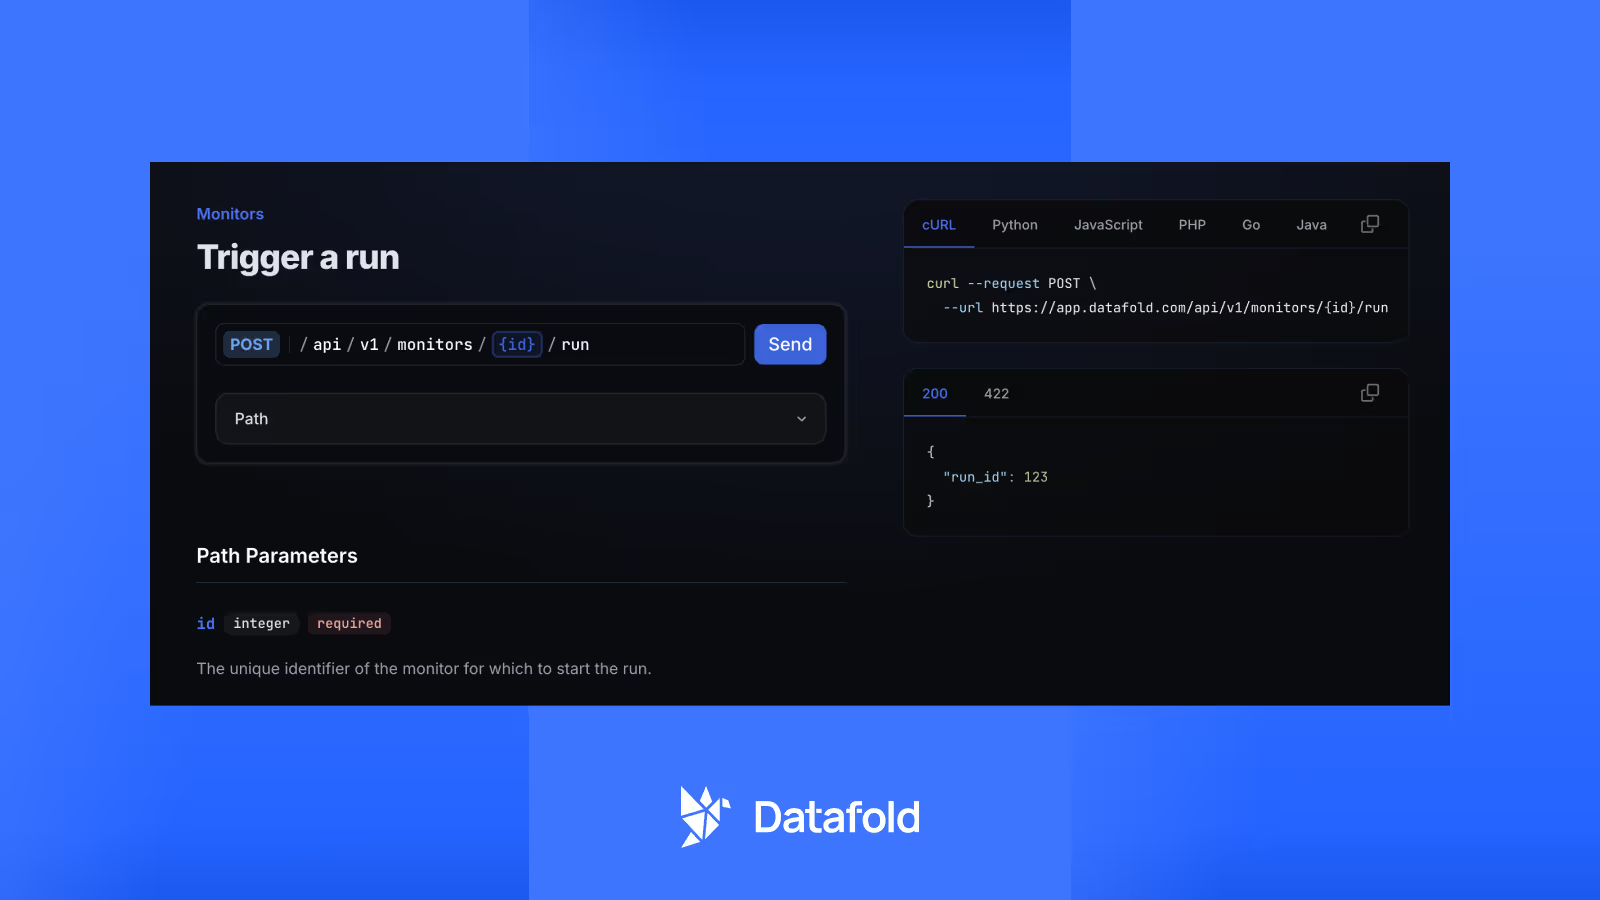
We know that as your data, business, and team scale, managing data quality grows in complexity. For teams with hundreds of thousands of monitors, we now support a REST API and custom naming and tagging, so your team can organize and create data quality monitors in a way that works for your data.
- REST API: It’s now possible to create, manage, and run monitors entirely via our new REST API. Anything that’s possible in the Datafold Monitors UI can be done programmatically as well.
- Custom names, descriptions, and tags for monitors: For customers with hundreds or thousands of monitors, it’s important to have good tools for staying organized. To that end, we now support custom names, descriptions, and tags for all monitor types.
Faster notification and resolution
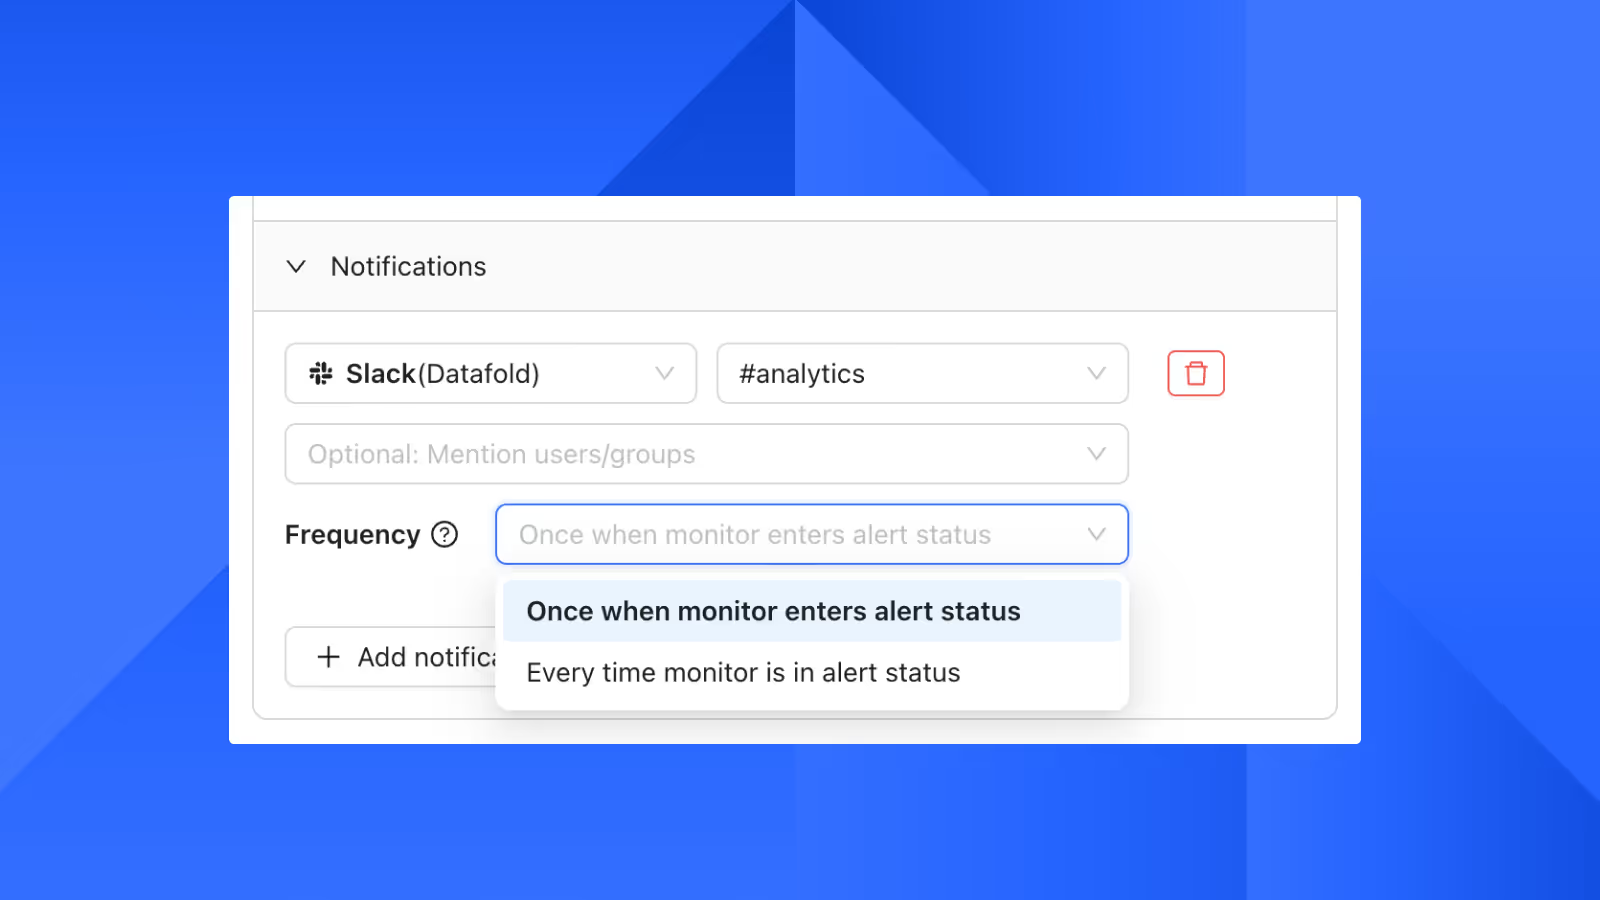
We’re introducing two powerful enhancements to streamline your alerting experience and improve data quality issue resolution. First, Recovery Notifications ensure you’re promptly informed when a monitor transitions back to an OK state, with added flexibility to customize how often you receive alerts. Second, for Data Test notifications, you can now attach a CSV of failed records directly to the alert, making it easier than ever to pinpoint and resolve issues without unnecessary delays.
- Recovery notifications: We now automatically send recovery notifications when a monitor goes from an alert state back to OK. Additionally, you have more control over the frequency of notifications—i.e. whether to receive a notification every time a monitor alerts, or only the first time it enters alert state.
- Attach CSV of failed records for Data Test notifications: Data Tests allow you to make assertions about your data, then get alerted when specific records fails those assertions. But when a test fails, you want to understand why as quickly as possible. That’s why we now allow attaching a CSV of failed records directly to notifications—so you don’t have to go digging around in your warehouse for problematic data.
Enhanced ease-of-use and insights
In addition, we’re introduction two major quality-of-life updates that make working with monitors even smoother and more insightful. With more granular filtering, it’s now easier than ever to locate specific types of metric monitors, whether you’re tracking freshness, row count, or custom metrics.
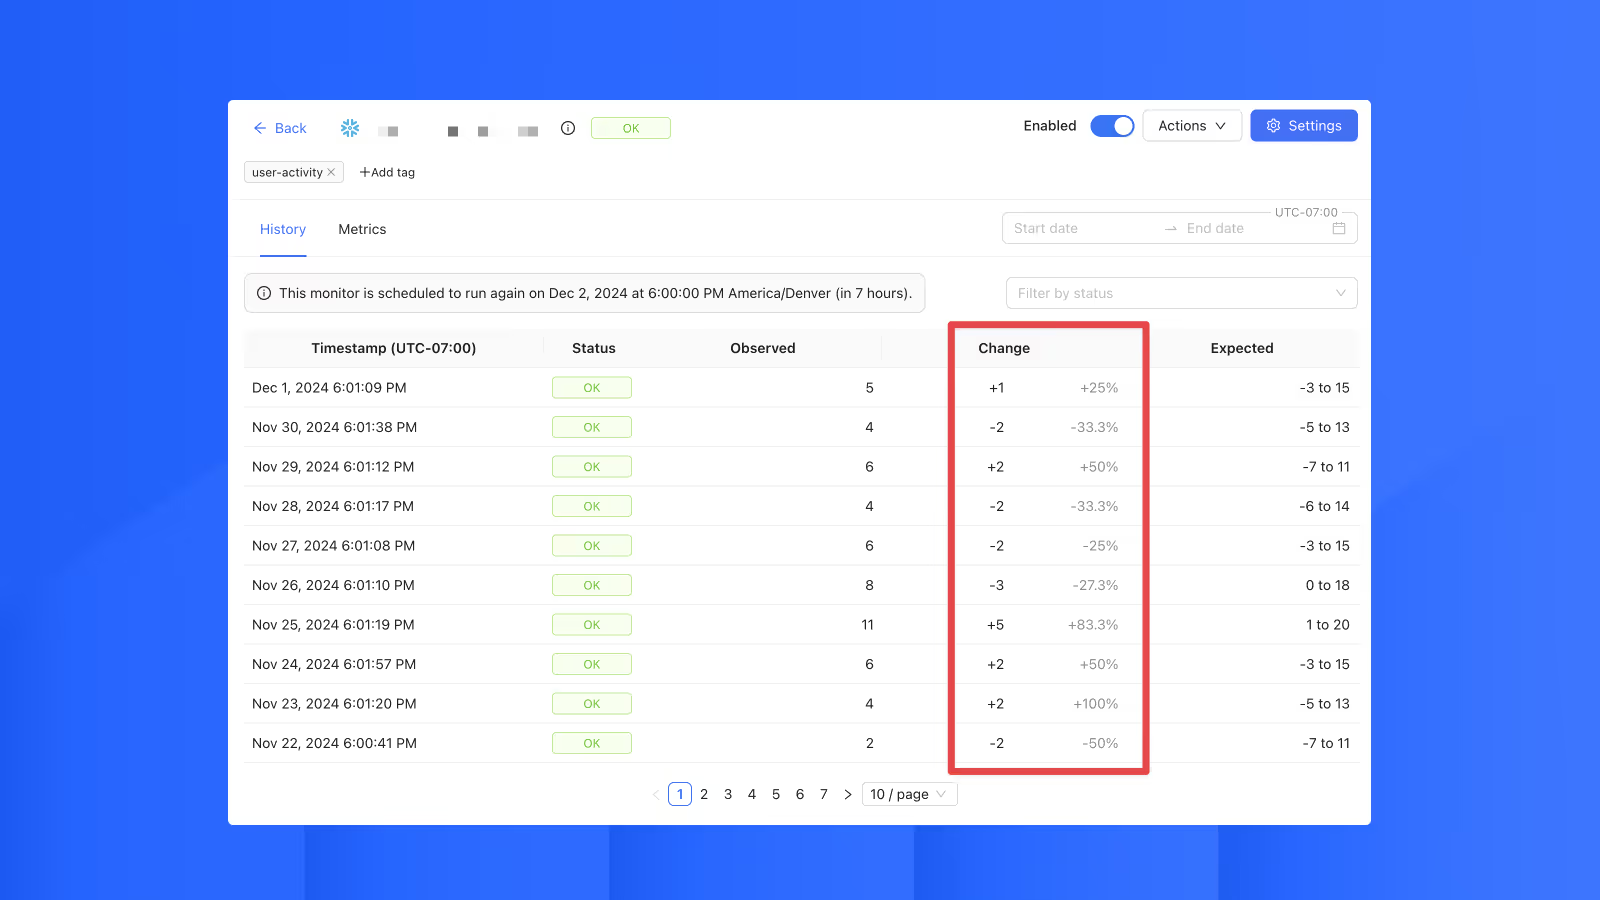
Additionally, we’ve added absolute and relative change displays for observed metric values, giving you a clearer view of how your data is evolving between runs—both in raw numbers and percentages.
- Standard Data Tests: Datafold will soon support out-of-the-box—no SQL required—Data Test monitors. For example, you’ll be able to quickly check for data that fail assumptions around uniqueness, nullness, accepted values, and/or referential integrity, all without writing any code.
- More granular filtering: We've introduced more granular filtering so you can easily find specific subtypes of metric monitors (e.g. freshness, row count, custom, etc.).
- Absolute and relative change for observed metric values: For metric monitors, we now display the change in observed value(s) from one run to the next, both in absolute and relative (%) terms.
Getting started
If your team is interested in getting started with Datafold Monitors, please reach out to our team to learn more and create your first monitor.

.avif)


