The State of Data Testing
To set the stage, let’s first discuss what data testing is all about and how it’s different from data observability. First, it’s important to note that Data Testing is part of the development and deployment workflow. The goal of Data Testing is to catch bugs before they hit production. Data Observability, on the other hand, is concerned with the state of your data after it has made it into production. Learn how data testing gets done today and the best practices for automating tests to improve data quality.

You would be hard-pressed to find anyone who doesn’t believe that it’s important to test your data, especially given the increased reliance on data to drive decision-making at companies. Data must be well-tested, accurate, and reliable, but all too often, data is broken, incorrect, and untested.
This guide to data testing hopes to change that. We’ll cover the current state of data testing and bring the Datafold view on what data testing should look like with Data -Diff, to ensure your pipelines run smoothly through automated and proactive data testing.
What is Data Testing?
To set the stage, let’s first discuss what data testing is all about and how it’s different from data observability. First, it’s important to note that Data Testing is part of the development and deployment workflow. The goal of Data Testing is to catch bugs before they hit production. Data Observability, on the other hand, is concerned with the state of your data after it has made it into production.
Data Testing validates data against a known correct state, often captured as invariants. For a simple example, the primary identifier for a table should never be null and always be unique. On the other hand, Data Observability is concerned with identifying anomalies in the data that may or may not be problematic, and its interpretation is left up to the analyst.
While both testing and observability are important parts of the overall health of your data pipelines, implementing data testing in development and deployment workflows is the most effective way to improve data quality: with proper data testing bad data doesn’t make it into production.
The Four Facets of Data Quality
To understand data quality, we can think broadly of four facets: accuracy, completeness, consistency, and integrity.
- Data Accuracy is the most easily understood measure and refers to how close the underlying data matches the real world.
- Data Completeness refers to how much data is available in the database. You would want every customer and every order captured, not just a subset.
- Data Consistency refers to the consistency of the data concerning itself. Names of entities should be the same across tables, but even columns should have consistent naming conventions.
- Data Integrity refers to the relationships between different tables within a database. A simple example: Every order should have a customer, and every customer that made an order should exist.
Given the many ways data testing can go wrong, data practitioners have developed a solid set of practices to test their data. I innocently asked a question on Twitter to better understand the state of data testing, and what I learned will SHOCK you.
https://twitter.com/pdrmnvd/status/1577355116734054400?s=20&t=exx5SSh96mnTiyVMwgJDqw
The State of Data Testing
1. Table Scan (SELECT * FROM… LIMIT 100)
The tried and true method. I call this one the table scan. Much like the database variant full table scan, which is the slowest method of scanning a table, the Table Scan testing method involves scanning a table with your eyes to see if anything pops, looks off, smells, or is suspicious. The reliability of this method is questionable, yet it remains one of the most pervasive methods of testing data.
https://twitter.com/digitallogic/status/1577374771347881985?s=20&t=dKrTONwP4Guti36qsqjl-w
https://twitter.com/the_tao_of_data/status/1577690729710637056?s=20&t=dKrTONwP4Guti36qsqjl-w
2. Quality Assurance (Stakeholders)
The next method of data testing is known as QA. Your QA team (stakeholders) are essentially indistinguishable from a machine-learning model with thousands of hours of training data behind them. While they may be slightly less intelligent than a Large Language Model (LLM) ChatBot, they are still quite adept at finding errors.
While this method can find more bugs than the Table Scan, it has flaws. Stakeholder QA tends to only work on data in production and only for the metrics the Stakeholders care about. The false positive rate is also very high, as stakeholders tend to think any number that makes their business look bad must be incorrect.
https://twitter.com/adz122/status/1577357353930076160?s=20&t=GOvoeJ9ireRv0m9HHnlJ1Q
https://twitter.com/chetchavat/status/1577355837181411341?s=20&t=GOvoeJ9ireRv0m9HHnlJ1Q
3. Counting Things
While the first two methods tend to be popular, they don’t use math, and math, as we all know, is so confusing it must be right. Using math, we can count things to summarize our data to see if the outputs meet our expectations not at a row level but in aggregate. However, while math is alluring, it can hide what we seek through mystical enchantments like averages and sums.
An average might hide that many values are null if we're not careful. Medians tend to hide outliers, which might be just the thing we’re looking for. It can also be tough to have a good intuition for a reasonable outcome. Try to estimate the sum of revenue before rolling it up and see how good your intuition is.
https://twitter.com/sarahmk125/status/1577362805459664907?s=20&t=O_4psnMaTKpMHM5iYs24BQ

4. Data Diff
As we climb the proverbial testing ladder, we ascend to the holy grail of testing: Data Diffs. Data Diff is a comparison for data which tells us, as we develop and change data transformation code (e.g. dbt SQL), how the data changes between iterations or in comparison with production.
https://twitter.com/ted_dunning/status/1577372259869548544?s=20&t=dKrTONwP4Guti36qsqjl-w
Here, we combine the previous method of aggregations and roll-ups with programmatic comparisons of every row. Every new row is identified, as is every lost row. Every value that changes is considered.
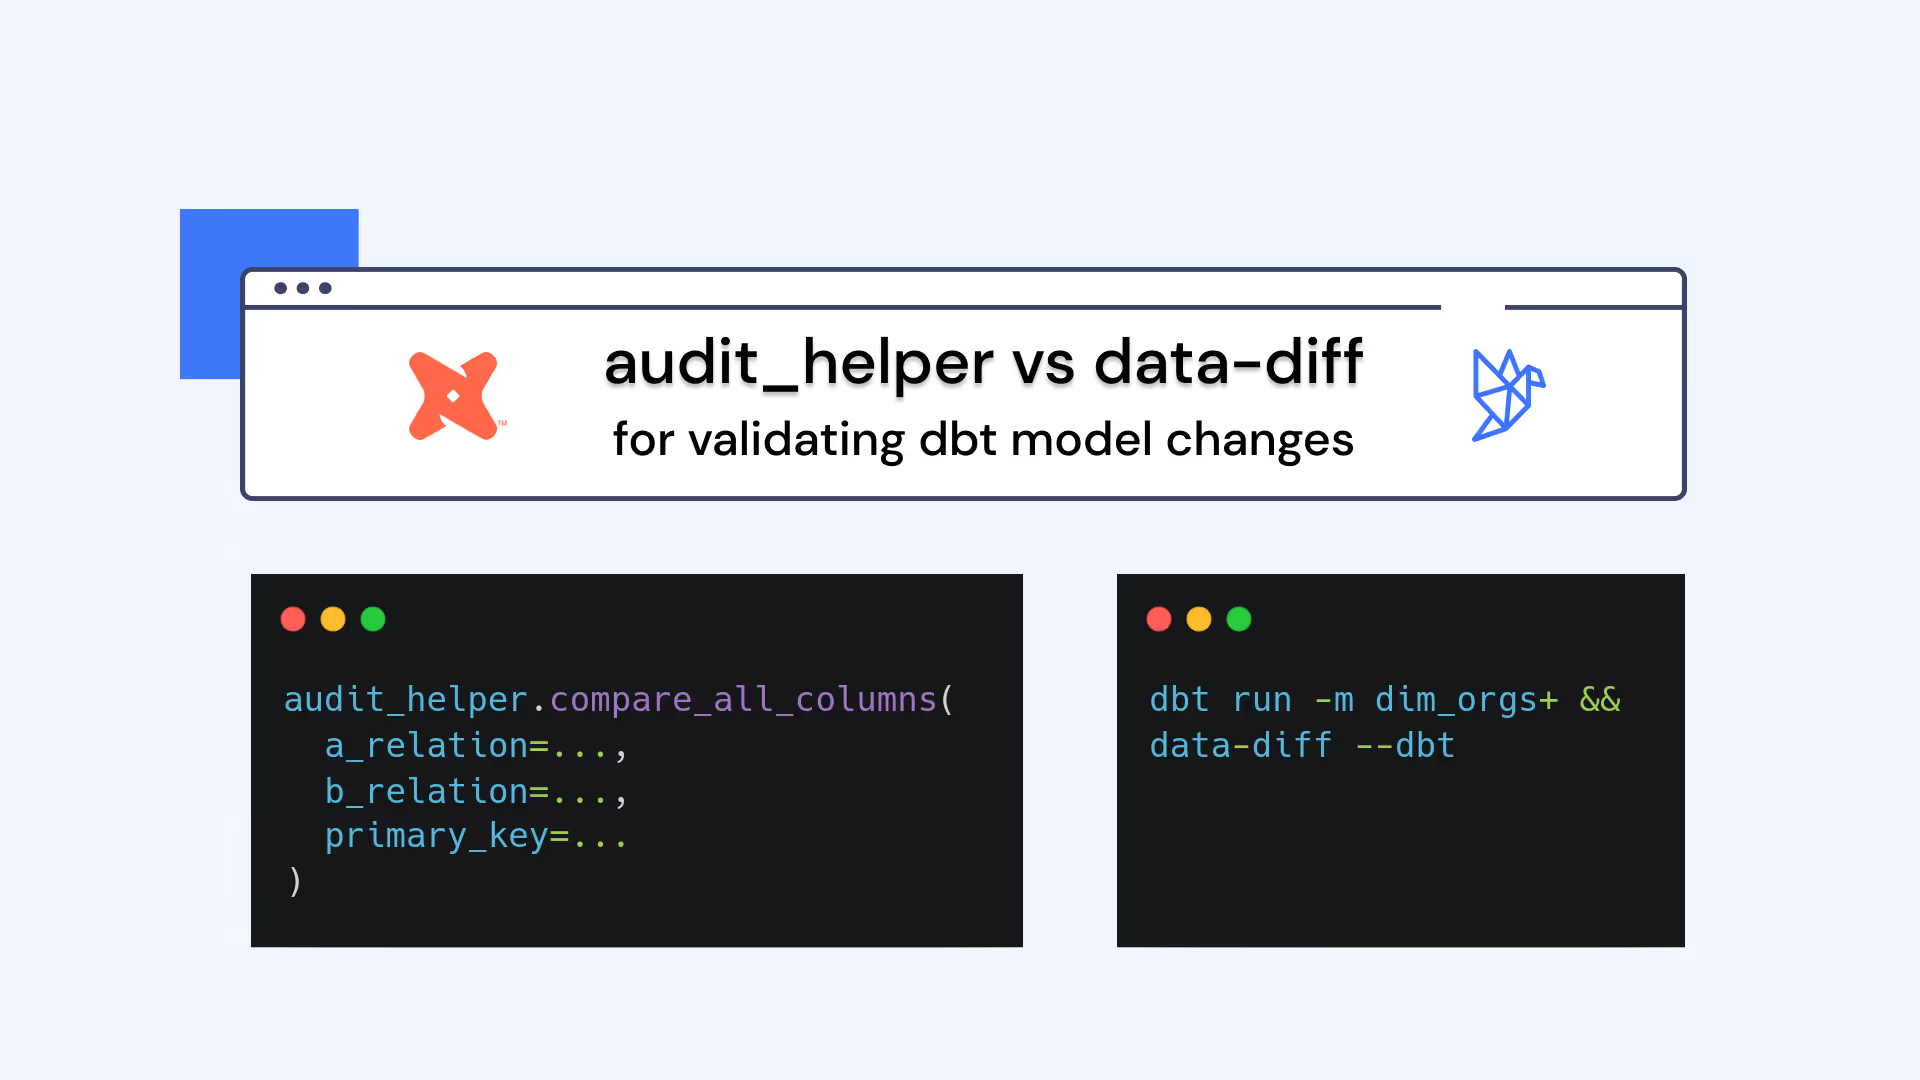
The only problem is this is the hardest method to achieve. Diffs can require a lot of complex SQL to perform correctly, and the outputs are often just as hard to parse as the raw data. This is what motivated Datafold to help make diffing data easier for data engineers by releasing an open-source data-diff tool that provides a fast and ergonomic way to compare data within or across databases at scale.
Being able to diff data fast is helpful, but given the complexity of modern data, it can be hard to interpret without proper visualization. That is where Cloud Data Diff comes in, providing a rich UI for executing, exploring and sharing data diffs.

Running and exploring diffs is helpful to individual data and analytics engineers, but to actually move the needle on data quality throughout the organization, data testing needs to become a process. Just like in software, testing is not effective unless it’s performed for every change, no matter how small, and ideally run as part of CI/CD process for data processing code.
Cloud Data Diff provides native integrations with Github/Gitlab and data transformation tools like dbt. Using Cloud Data Diff, teams can fully automate data testing for every pull request to their data transformation code and gain instant visibility into the impact any change to data transformation code will have on data and its applications.

Thus, when embedded in development and deployment workflows, Data Diff can help us automate data testing across all facets of data quality:
- Data accuracy can be tested by looking at individual rows in your new datasets and aggregates to see if values meet your expectations. You likely already know how many customers or the total revenue you have, so being able to quickly assess that these values are in-line with your expectations without having to do custom roll-ups can save a lot of time.
- Data Completeness is ensured through histograms and summary views that describe how many rows have null primary keys and what percentage of every column is blank through column-profiles.
- Data consistency is checked across tables through value-level checks, and integrity is maintained by analyzing table dependencies.
- Data integrity is validated by running diffs not only for the table whose code was modified, but for all downstream tables. This ensures that the entire DAG is tested and there are no breaking points.
If your executives, stakeholders or customers cannot afford to have erroneous data in production; or if your data teams need to operate at pace with no margin for error - it’s time for Data Diff.


.avif)


